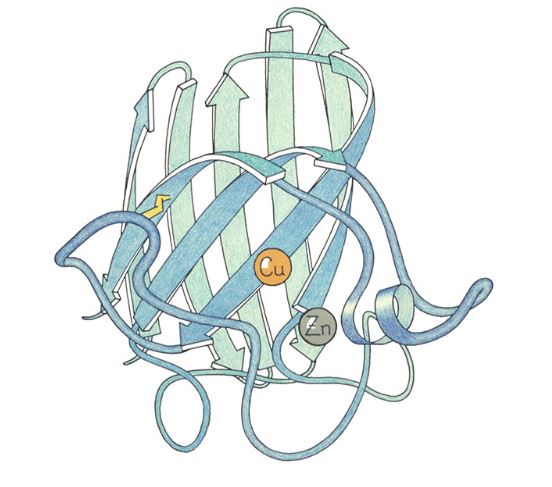
Ribbon Diagrams – Richardson Diagrams
If you read much that touches on the science of proteins, you’ve probably seen ribbon diagrams. They’re just there, part of the lore, as one commenter on Bluesky observed.
But someone had to develop them. That someone was Jane Richardson, professor of biochemistry at Duke University.
I learned that a few years back, when I looked for a Scientific American article on the internet. Didn’t find it. I was recalling a night in Sagamore Park when young Jane collected a group of us to observe the track of Sputnik. She had a way to calculate its orbit from visual observations, and we made those observations. She was one of the first to calculate the orbit, IIRC, and her method was written up in the Scientific American “Amateur Scientist” column. It was very exciting for a group of young astronomers.
In 2018, Duke published a long article on her life and how she developed ribbon diagrams. I can’t say much about them because protein chemistry isn’t my thing, but I remember when they came into use. They were obviously easier to comprehend than other chemistry diagrams of the time.
Her path to biochemistry was unconventional, with a master’s degree in philosophy, the subject she took up instead of the astronomy and physics she started with as an undergraduate. That background has served her well.
I found her when I searched for that Scientific American article and wondered why we hadn’t heard more about the originator of those scientifically ubiquitous diagrams. Actually, I didn’t wonder much. One more example of a woman not getting credit. I’ve wondered, too, how much discrimination against women had to do with her circuitous route into biochemistry.
So I was glad to see an article circulating on Bluesky about her development of those diagrams. Maybe, as some have done, they should be more generally called “Richardson diagrams.”
Cross-posted to Nuclear Diner


