
Excess deaths in America during epidemics: Comparing COVID-19 and the Spanish flu
This post is a foray into amateur epidemiology, which as Richard Epstein can tell you is something that law professors are uniquely well-suited to pursue (NOT).
So I welcome corrections, caveats, objections etc.
Perhaps the most basic question about any epidemic is, how many people have died during the epidemic that wouldn’t have died if it hadn’t happened? This is not the same question as that of how many people have died from the epidemic disease itself, because epidemics have secondary effects, that lead to both higher and lower mortality, apart from the direct effects of contracting the disease itself.
We’ve just passed the one year anniversary of the first recorded COVID-19 death in the USA. How many more people have died over the last year in America than would have died if there had been no epidemic? The CDC’s current estimate of that figure is 594,204, of which 156,486 are being attributed to causes other than COVID-19.
This figure, if I understand the technical notes accompanying it correctly, is derived by simply comparing the total deaths during the epidemic to the projected number of total deaths that would have happened over the same period if age-adjusted all-cause mortality had remained what it was prior to the epidemic. Note that it’s also incomplete at any particular time, as there’s always a lag of several weeks in regarding to reporting and analyzing all the data from local sources.
So we’ve seen both an enormous number of deaths from COVID-19, and a very large number of other excess deaths. Some of these are no doubt COVID-19 deaths that have been incorrectly categorized. Others are from spillover effects: people not seeking or being unable to obtain medical care being the most obvious such effect, but there are no doubt many more. (It’s symptomatic of how far around the bend the entire right wing media apparatus has gone that I’ve heard the claim several times recently from people who weren’t visibly foaming at the mouth that number of deaths in the USA over the past year didn’t even go up compared to the year before, and also hospitals get paid extra to categorize deaths as being from COVID-19 etc. etc.).
In regard to excess mortality, the differences between the current epidemic and the 1918-19 Spanish flu epidemic appear to be striking. The standard estimate of how many people in the USA died as a result of contracting the Spanish flu is around 675,000.
One problem with any comparison between the two epidemics is that public health statistics in the USA were much less reliable 100 years ago, let alone worldwide. For instance, on a global scale estimates of the death toll from the 1918-19 epidemic still vary wildly, from 17 million to 100 million.
With that caveat in mind, let’s look at the excess mortality statistics for the USA in 1918 and 1919. Note that, very much unlike the case with COVID-19, the large majority of Spanish flu deaths were among young adults, meaning that almost all such deaths could be categorized as excess deaths, since very few of these people would have died otherwise. Note too that World War I combat deaths had a fairly small effect on the 1918 statistics, since as best as I can determine about 40,000 Americans died in combat in 1918 (the majority of deaths in the American armed forces during that war were non-combat related, and the very large majority of this latter group were as a result of the Spanish flu).
First, let’s look at what happened to the age-adjusted mortality rate. For mortality to be age-adjusted means that the observed mortality rate is transposed from the population in question onto a modal population age distribution, to account for the fact that age is usually by far the biggest predictor of mortality risk. So for example the fact that the median age of the population in the USA in 1900 was 23 while today it’s 38 means that, all other things being equal, the unadjusted mortality rate in the USA today would be much higher than it was in the early decades of the previous century, simply because we have a much older population now. Age- adjusted mortality controls for this. In the statistics below, the modal population in terms of age distribution for purposes of calculating age-adjusted mortality is the USA in 2000.
Excess Mortality in the USA During the Spanish Flu Epidemic
Age-adjusted mortality rate per 100,000
1913: 2,207
1914: 2,149
1915: 2,175
1916: 2,267
1917: 2,276
1918: 2,542
1919: 2,057
1920: 2,147
1921: 1,958
1922: 2,050
1923: 2,141
1924: 2,038
Average age-adjusted mortality rate per 100K 1913-17: 2214.8
Average age-adjusted mortality rate per 100K 1918-19: 2299.5
The strange thing about these numbers that should immediately jump out is the low mortality rate in 1919.
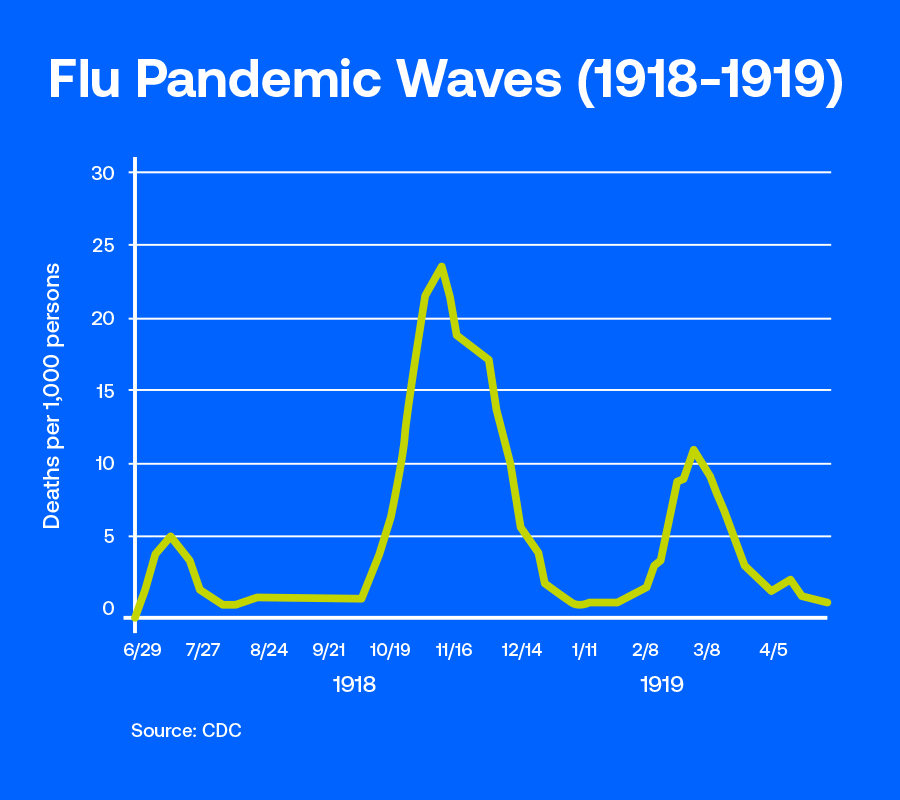
The epidemic featured three waves: a small one in the early summer of 1918, a big one in the fall of 1918, and a medium-sized one in the first few months of 1919. As far as I’ve been able to determine, roughly one quarter of all Spanish flu deaths happened in 1919. If we assume, conservatively, that 95% of all Spanish flu deaths were among people who wouldn’t have died otherwise, we would expect about 160,000 excess deaths just from the Spanish flu alone in 1919. Yet the age adjusted mortality rate in 1919 was lower than in any previous year in the 20th century. (Note that this is in a population that was less than a third as large as the current American population, meaning that Spanish flu deaths in 1919 alone are estimated to have been on a per capita basis about as numerous as COVID-19 deaths have been over the past year).
Now, how many people actually died in the USA in 1918 and 1919? To answer that, we have to look at the crude mortality rate, that is, the mortality rate unadjusted for longitudinal changes in the age distribution of the population. This is simply the ratio between the total population and the number of deaths in it in the subject year:
Crude mortality rate per 1000:
1913: 13.81
1914: 13.30
1915: 13.18
1916: 13.81
1917: 13.97
1918: 18.10
1919: 12.89
1920: 12.99
Note that while age-adjusted mortality went up 14.76% in 1918 over the 1913-1917 baseline, the crude death rate went up 32.95% in 1918 over that same baseline.
Furthermore, while age-adjusted mortality went down 7.1% in 1919 over the 1913-1917 baseline, the crude death rate went down 5.3% in 1919 over that baseline.
Note as well that if you extrapolate the age-adjusted mortality rates in these years onto the current US population you would get about three times as many deaths as actually happened in these years, because the population was so much younger then. (Age-adjusted mortality in the USA in 2019 was 715 per 100,000).
Using these statistics to try to determine how many expected deaths there would have been in the US population but for the Spanish flu pandemic, we get the following results:
Crude death rate 1913-1917: 13.614
Expected deaths in 1918, employing the 1913-17 baseline: 1,405,100
Total deaths 1918: 1,868,100
Expected deaths in 1919, employing the 1913-1917 baseline: 1,422,799
Total deaths 1919: 1,347,134
If we assume that 675,000 people died from Spanish flu in 1918 and 1919, and we treat 95% of all Spanish flu deaths as excess deaths, and we further assume that 75% of all such deaths happened in 1918, then the excess death total in 1918 in the USA is pretty much exactly what you would have expected it to be, assuming the epidemic had no significant spillover effects on other causes of mortality in either direction.
By contrast, 1919 presents a major puzzle. Instead of the 160,000 excess deaths we would have expected, based on the above assumptions, mortality totals were about 76,000 lower than we would have expected them to be if there had been no epidemic. This means we have 236,000 missing deaths in that year, again assuming no spillover effects from the epidemic in either direction.
Overall, there appear to have been approximately 387,000 excess deaths in the US in 1918 and 1919 combined, meaning that, if we assume again that 95% of Spanish flu deaths were excess deaths — that is, deaths that would not have occurred but for the epidemic — we have about 254,000 missing excess deaths, assuming 675,000 total Spanish flu deaths and no spillover effects from the epidemic either way.
This suggests that two factors may be at play, in some unknown combination:
(1) The estimates of how many people actually died from the Spanish flu in the US are 40% too high; and/or
(2) To the extent that those estimates aren’t too high, the societal effects of the Spanish flu significantly reduced other causes of mortality over the course of the epidemic. This I suppose is possible, at least to some extent: infectious disease mortality was much higher 100 years ago, so measures put in place because of the Spanish flu epidemic could have had significant positive spillover effects in regard to mortality from other causes. Other societal factors might well have played a role as well.
That’s all I’ve got for now.